A useful weekly metrics review for a small Shopify store fits on one page and takes 30 minutes. Track about eight numbers (sessions, conversion funnel, orders, average order value, refunds, open support chats, top customer question and messaging spend), keep raw counts next to every percentage, write down what else happened that week, and finish with one decision that has an owner and a date.
I'm opinionated about this because I've seen founders lose whole Monday mornings to dashboards. They open six apps, screenshot charts, and close the laptop knowing roughly what they knew before. The point of looking at numbers is to decide what to do next. If the review doesn't change anything, it's too big.
Which Shopify store metrics actually matter each week?
Here's the page I'd keep. Eight rows, the same every week, so you can compare.
Metric
Where to find it
Why it's here
Sessions
Shopify Analytics
Tells you if traffic moved before you blame the store
Funnel: added to cart, reached checkout, completed
The funnel row comes from Shopify's conversion rate breakdown, which splits sessions into those that added to cart, reached checkout and completed checkout. That's the single most useful report for a small store. A drop between cart and checkout is a different problem from a drop between landing and cart.
If you collect reviews, add a ninth row for new reviews, and define it precisely. Our guide to measuring review collection rate explains why "reviews per order" is trickier than it looks.
Use WhatFlow's recipient report to separate attempted, delivered, read and failed messages. Export the results before you change the audience, and investigate a failure before retrying it. If you want to measure purchases, compare against Shopify orders using the tracking you set up for that send; delivery or read status alone can't tell you what sold. See the campaign measurement walkthrough.
Write the definitions down once
Different apps count different things under the same label. "Conversion" in your ad platform, your email tool and Shopify can mean three different events over three different time windows. "Resolved" in an inbox might mean "someone replied" or "the customer's problem is fixed".
So at the top of the sheet, write one line per metric: what counts, and from where. "Orders = paid Shopify orders, excluding test orders and draft orders." It takes ten minutes once and saves arguments forever.
Keep raw counts next to every rate
Small stores get fooled by percentages constantly. Say you sent a WhatsApp campaign to 40 people and 4 bought. That's a 10% conversion rate, which sounds amazing. It's also four orders. Next week, 2 out of 40 buy and it "halves". Nothing happened. That's noise.
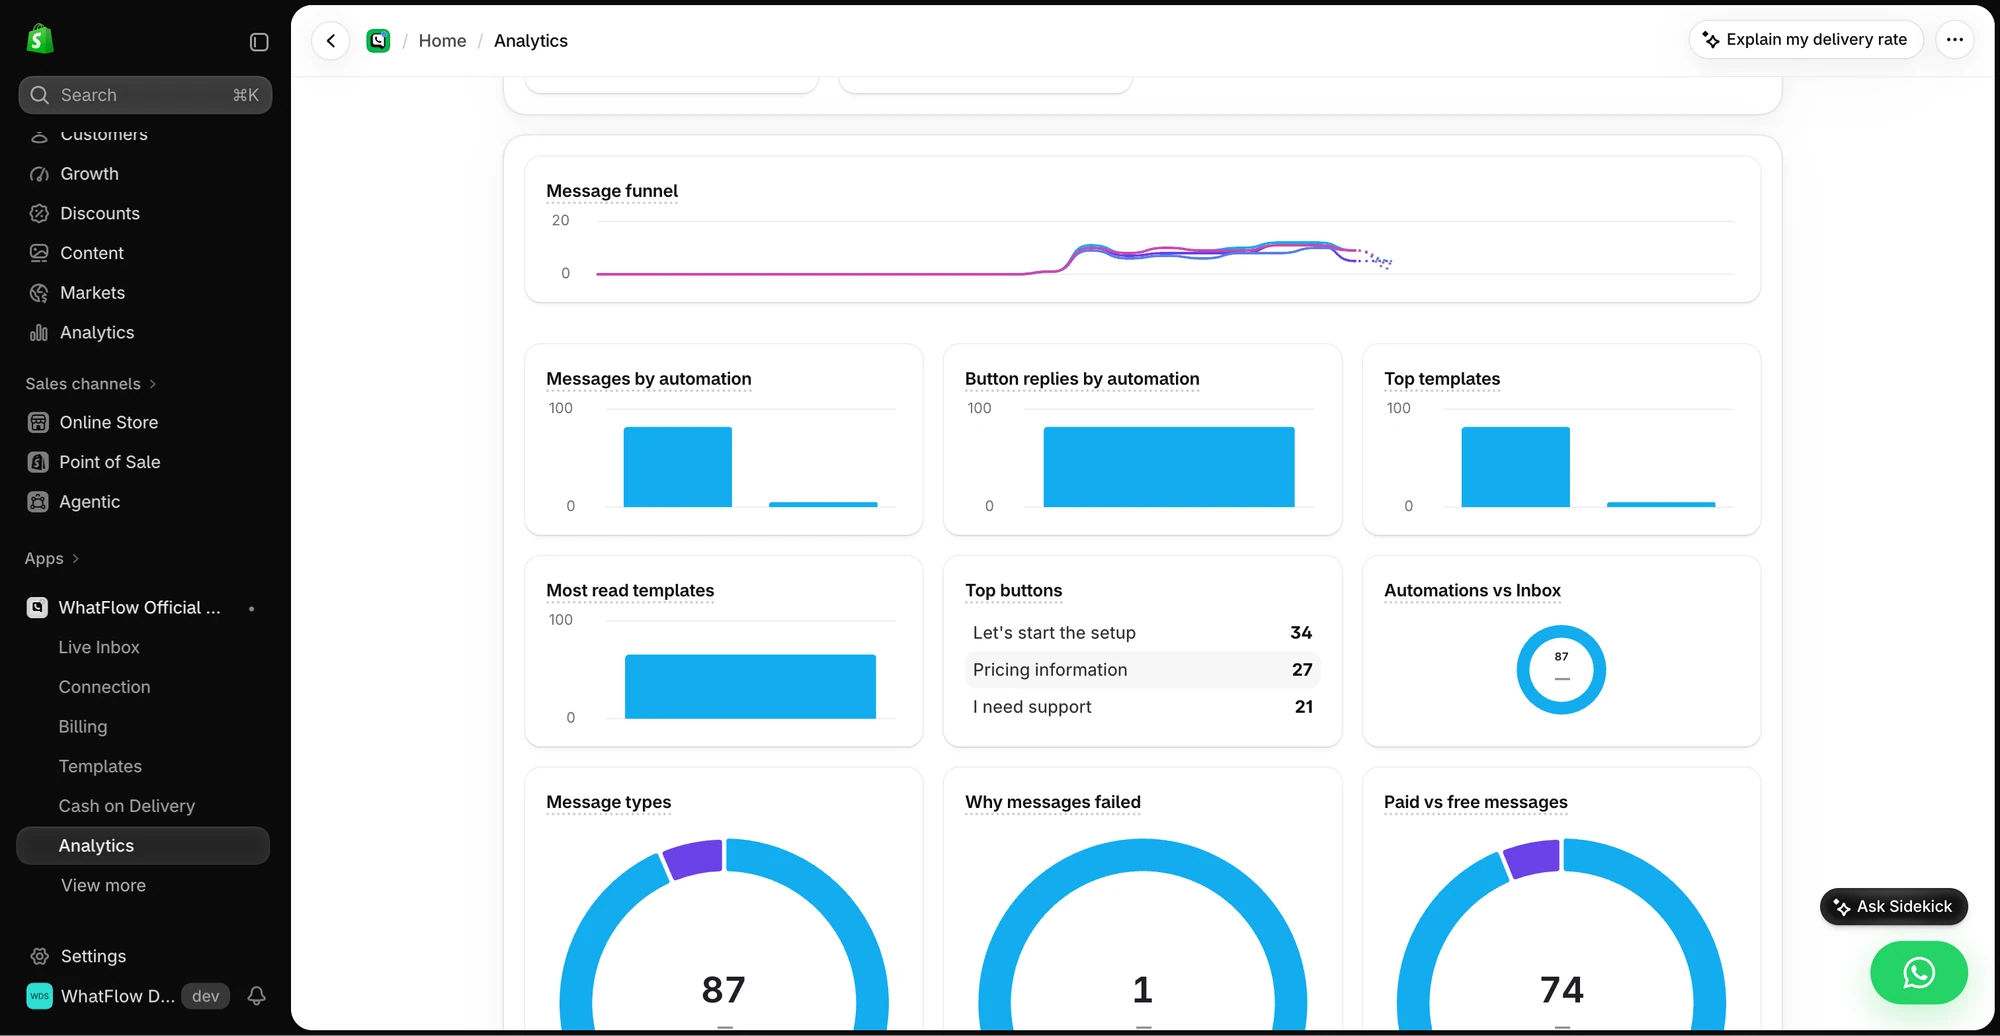
The Analytics view shows message and button reply breakdowns for the demo store. The numbers are demo activity, not a performance benchmark.
My rule: never write a percentage on the sheet without the count beside it. "Conversion 2.1% (63 orders / 3,000 sessions)". The count stops you from building a theory on four people.
Write down what else happened
Next to the numbers, keep a short context column. Every week, note:
Stock-outs (especially on a top seller)
Promotions, codes or price changes
Ad spend changes or a new traffic source
Shipping problems, courier changes
Site changes: new theme section, new app, new popup
Imagine orders drop 20% in a week. Without the context column, you start redesigning the product page. With it, you see your best-selling size was out of stock for four days. Different problem, much cheaper fix.
Read ten customer messages
This is the step most founders skip, and it's the one I'd keep if I could keep only one. Open your inbox and read ten recent pre-purchase conversations. Not a summary, the actual messages. Write down the most repeated question in plain words.
While you're in the inbox, count open conversations and sort them: waiting on the customer, waiting on you, waiting on a courier or supplier. The "waiting on you" pile is the one that needs action this week.
Put messaging costs on the sheet
Messaging is a real cost, and it's easy to ignore because it's spread across tools. Add up the week's spend: Meta's WhatsApp charges, your email and SMS bills, and any app subscriptions tied to messaging.
Meta charges per delivered template message, with rates that depend on the message category and the recipient's country. As of October 1, 2026, Meta also charges for service messages above a free tier of 1,000 per phone number per month (Meta's pricing page). Those charges are separate from whatever your WhatsApp app costs.
On the app side, it helps when the bill is predictable. WhatFlow has no seat fees and puts every feature on every plan (including Free), so the main variable is message volume rather than how many teammates you added. Our guide to budgeting WhatsApp by cost per outcome shows how to judge whether a campaign was worth what it cost, and the Shopify app cost audit helps with the rest of the stack.
End with one decision
The last five minutes are the whole point. Pick the single most useful change for next week and write it like this:
Decision: Add laptop-with-case measurements to the Classic Sleeve page.
Why: 4 of 10 pre-sale chats asked about it; add-to-cart on that page dipped while sessions held steady.
Owner: Hina. Check on: next Monday's review.
One decision. Not five. If nothing on the sheet justifies a change, write "no change, keep watching" and close the laptop. That's a legitimate outcome.
A worked example
Let's walk through a hypothetical week for a small accessories store.
Sessions: 3,100 (last week 3,000). Flat.
Funnel: 9% added to cart, 4% reached checkout, 2% completed (62 orders). Cart-to-checkout dropped from 5% last week.
Context: free-shipping threshold raised from $40 to $50 on Wednesday.
Ten messages: three asked "is shipping free?"
Decision: show the $50 threshold in the cart drawer with how much more the shopper needs to add. Owner: Omar. Review next Monday.
Templates, COD confirmation, Shopify Flow automations and a shared team inbox with no seat fees. Every feature is included on every plan, including Free.
The best metrics routine is the one that survives a busy week. Same sheet, same day, same eight rows. Once it's a habit, add a metric only if it would change a decision you actually make. If you run WhatsApp campaigns, the WhatsApp marketing metrics guide covers which channel numbers deserve a row.
Frequently asked questions
What metrics should a small Shopify store track weekly?
Sessions, conversion rate with its funnel stages, orders, average order value, refunds or returns, open support conversations, the most common customer question, and messaging spend. Keep raw counts next to every percentage.
Where do I find conversion funnel data in Shopify?
Shopify's behaviour reports include a conversion rate breakdown showing sessions, sessions with add-to-cart, sessions that reached checkout and sessions that completed checkout.
How do I know if a change in my numbers is real?
Look at the raw counts, not just the rate, and check what else changed that week: stock-outs, promotions, ad spend or a new traffic source. Small stores see big percentage swings from a handful of orders.
What should a weekly metrics meeting produce?
One decision with an owner and a date, or an explicit decision to keep watching. If the review never changes anything, cut it down until it does.